Actual Tests
Writing Task One – 25/4/2019
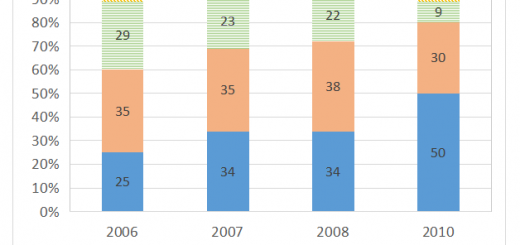
The bar chart shows the percentage of car manufactures’ total car sales in different regions from 2006 to 2010. The bar chart reveals the changes in the proportion of cars sold by car producers...
Writing Task One (tables of figures) – 14/02/2019
The table shows the expenditure on various types of food in Italy in 1992, 2002 and 2012. The table illustrates the changes in spending on seven different foodstuffs in Italy over a 20-year period...
Cập nhật đề thi IELTS Writing 2019 (update liên tục)
6/4/2019 Task 1: The bar chart shows the rate of males and females who were overweight in Australia from 1980 to 2010. Task 2: People have little understanding of the importance of the natural...
Writing Task One (maps) – 13/4/2019
The maps below show the changes in the floor plan of an art gallery in 2015 and the present day. The maps illustrate the changes that have taken place in an art gallery from...
Writing Task One (bar chart) – 6/4/2019
Sample essay The bar chart displays the changes in the proportion of people being overweight for both genders in Australia over a 30-year period from 1980 to 2010. Looking first as a whole, the...